04/08/26 Tue 9:07am
EV Component Sizing
Dr.P.Rangarajan
Why Proper Sizing Matters?
- Ensures optimal performance, efficiency, and durability
- Matches power delivery to driving demands
- Helps manage energy use and heat generation
Main Components to Size:
- Electric Motor - Delivers required torque and speed
- Battery Pack - Stores and supplies energy for driving range and performance
- Power Electronics - Manages Power flow between battery and motor
- Drive train - Transfers motor output to wheels efficiently
EV Vs Ice Powertrain Sizing
- ICE: Focus on engine displacement and fuel efficiency
- EV: Emphasis on motor power, battery capacity and energy efficiency
Unique EV Challenges
- Must deliver instantaneous power for quick acceleration
- Sustain power for cruising and uphill driving
- Enable regenerative breaking for energy recovery
- Require thermal management to avoid overheating and ensure reliability
Vehicle Dynamics
Understanding the Forces that move an Electric Vehicle:
Rolling Resistance: Opposition to motion due to tire deformation and road surface interaction
Aerodynamic Drag: Air resistance acting against the vehicles motion
Grade Force: Component of weight acting along the road on an incline
Inertial Force: Force required to accelerate the vehicle and its mass
Step by Step Procedures:
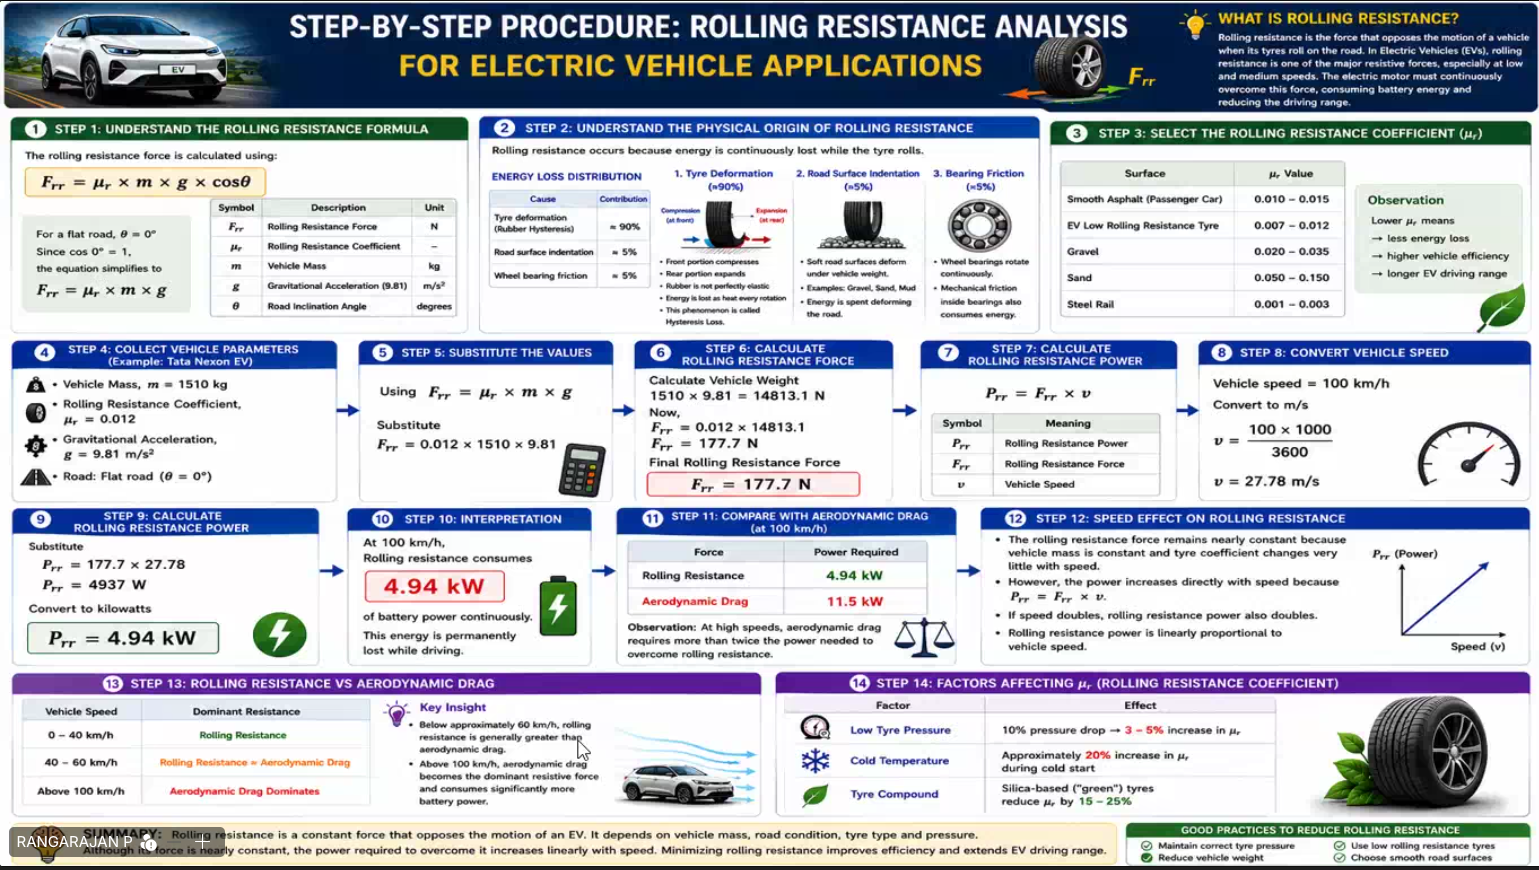
1. Rolling Resistance Analysis for Electric Vehicle Applications
1.Understand the Rolling Resistance Formula
The rolling resistance force is calculated using:
Note
For a flat road,
Since ,
the equation simplifies to
| Symbol | Description | Unit |
|---|---|---|
| Rolling Resistance Force | N | |
| Rolling Resistance Coefficient | - | |
| Vehicle Mass | kg | |
| Gravitational Acceleration (9.81) | ||
| Road Inclination Angle | degrees |
2. Understand the Physical Origin of Rolling Resistance
| Cause | Contribution |
|---|---|
| Tyre deformation (Rubber Hysteresis) | |
| Road surface indentation | |
| Wheel Bearing friction |
1. Tyre Deformation
- Front portion compresses
- Rear portion expands
- Rubber is not perfectly elastic
- Energy is lost as heat every rotation
- This phenomenon is called hysteresis loss.
2. Road Surface Indentation
- Soft road surface deform under vehicle weight.
- Examples: Gravel, Sand, Mud
- Energy is spent deforming the road.
3. Bearing Friction
- Wheel bearings rotate continuously.
- Mechanical friction inside bearings also consumes energy
3. Select the Rolling Resistance Coefficient ()
| Surface | Value |
|---|---|
| Smooth Asphalt (Passenger Car) | 0.010 - 0.015 |
| EV Low Rolling Resistance Tyre | 0.007 - 0.012 |
| Gravel | 0.020 - 0.035 |
| Sand | 0.050 - 0.150 |
| Steel Rail | 0.001 - 0.003 |
Observation
Lower means
→ less energy loss
→ higher vehicle efficiency
→ longer EV driving range
4. Collect Vehicle Parameters
Example: Tata Nexon EV
- Vehicle Mass,
- Rolling Resistance Coefficient,
- Gravitational Acceleration,
- Road: Flat road ()
5. Substitute the Values
using the equation
and upon substitution
6. Calculate Rolling Resistance Force
Calculate vehicle weight
Now,
Final Rolling Resistance Force
7. Calculate Rolling Resistance Power
| Symbol | Meaning |
|---|---|
| Rolling Resistance Power | |
| Rolling Resistance Force | |
| Vehicle Speed |
8. Convert Vehicle Speed
Vehicle speed = 100 km/h
Convert to m/s
9. Calculate Rolling Resistance Power
Substitute
Convert to kilowatts
10. Interpretation
At 100 km/h,
Rolling resistance consumes of battery power continuously. This energy is permanently lost while driving.
11. Compare with Aerodynamic Drag (at 100 km/h)
| Force | Power Required |
|---|---|
| Rolling Resistance | 4.94 kW |
| Aerodynamic Drag | 11.5 kW |
| Observation: at high speeds, aerodynamic drag requires more than twice the power needed to overcome rolling resistance. |
12. Effect of Speed on Rolling Resistance
- The rolling resistance force remains nearly constant because vehicle mass is constant and tyre coefficient changes very little with speed.
- However, the power increases directly with speed because
. - If speed doubles, rolling resistance power also doubles.
- Rolling resistance power is linearly proportional to vehicle speed.
13. Rolling Resistance VS Aerodynamic Drag
| Vehicle Speed | Dominant Resistance |
|---|---|
| 0 - 40 km/h | Rolling Resistance |
| 40 - 60 km/h | Rolling Resistance Aerodynamic Drag |
| Above 100 km/h | Aerodynamic Drag Dominates |
[! Key Insight]
- Below approximately 60 km/h, rolling resistance is generally greater than aerodynamic drag.
- Above 100 km/h, aerodynamic drag becomes the dominant resistive force and consumes significantly more battery power.
14. Factors Affecting (Rolling Resistance Coefficient)
| Factor | Effect |
|---|---|
| Low Tyre Pressure | 10% pressure drop → 3 - 5% increase in |
| Cold Temperature | Approximately 20% increase in during cold start |
| Tyre Compound | Silica-based “green” tyres reduce by 15 - 25% |
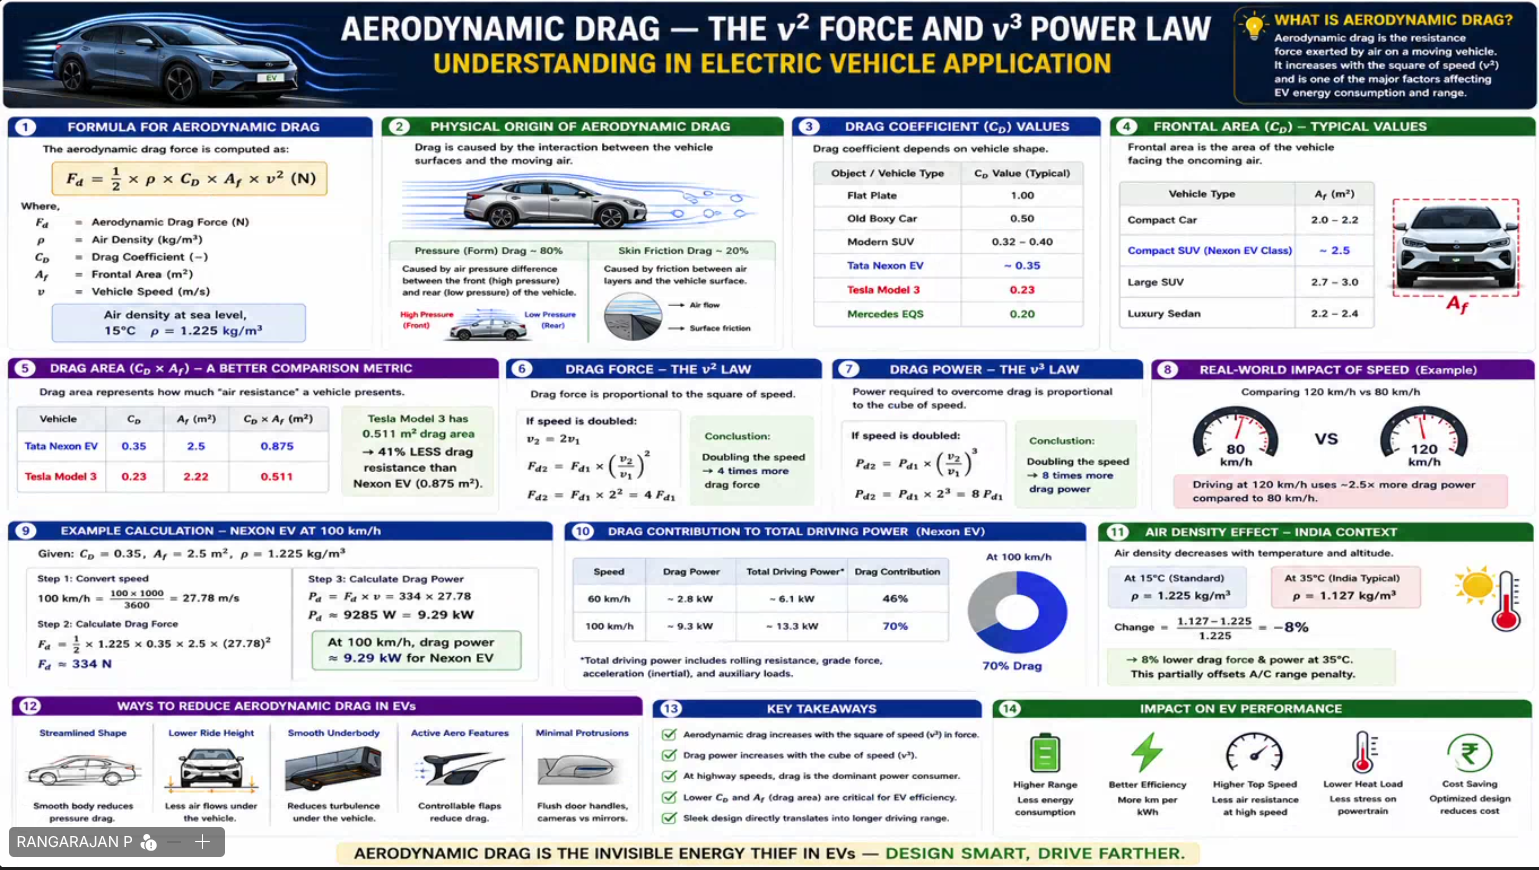
2. Aerodynamic Drag - the Force and Power Law